[Uni Tübingen] - [Mat.-Nat. Fakultät] - [Fachbereich Chemie] - [Anorg. Chemie] - [Klaus Eichele] - [NMR Ramblings] - [Spin Systems] - AB Spin System
 |
Spin System: AB Analysis |
Contents
This page contains:
- a form to extract coupling constants and chemical shifts from observed frequencies,
- and simulations using the solution.
For general information on the AB spin system, see this page: AB, General Information.
Input Section
 |
Please enter the four frequencies (in Hz) of the peaks in descending order and the frequency SF of the reference compound (in MHz), as well as the desired total width of the simluated spectra in pixels (be reasonable ;-):
| AB spectrum: | v1 = 2468.2 Hz | v2 = -4568.3 Hz | v3 = -14406.3 Hz | v4 = -21444.6 Hz |
| JAB (std. dev.): | 7037.40 (0.90) Hz | |||
Solution:
| fo: | -9487.75 Hz | ||
| D: | 15338.00 Hz | ||
| JAB: | 7037.40 Hz | ||
| D/JAB: | 2.18 | ||
| 2C: | 16875.40 Hz | ||
| (2C-D)/2: | 768.70 Hz / 4.12 ppm | ||
| vA: | -1818.75 Hz | δA: | -9.7519 ppm |
| vB: | -17156.75 Hz | δB: | -91.9925 ppm |
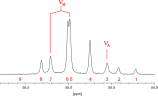
Simulation of AB
(Interested in the image? Here is information on the SVG graphics: SVG)
| v1 = | 2468.65 Hz | I1 = | 0.5830 | plot limits: | |
| v2 = | -4568.75 Hz | I2 = | 1.4170 | high frequency: | 4859.93 |
| v3 = | -14406.75 Hz | I3 = | 1.4170 | low frequency: | -23835.43 |
| v4 = | -21444.15 Hz | I4 = | 0.5830 | ||
References
- Günther, H. NMR-Spektroskopie, Eine Einführung. Georg Thieme Verlag, Stuttgart, 1973.
- Garbisch, E. W., Jr., J. Chem. Educ. 1968, 45, 402-416, DOI: 10.1021/ed045p402.
- Dischler, B. Angew. Chem. 1966, 78, 653-663, DOI: 10.1002/ange.19660781302;
Angew. Chem. Int. Ed. Engl. 1966, 5, 623-633, DOI: 10.1002/anie.196606231.
[ Anorg. Chemie ] | [ Go Home ] | webm@ster | created: 02.01.2013 | last modified: 20.03.2020