[Uni Tübingen] - [Mat.-Nat. Fakultät] - [Fachbereich Chemie] - [Anorg. Chemie] - [Klaus Eichele] - [NMR Ramblings] - [Processing] - Peak Picking
 |
NMR Processing:
|
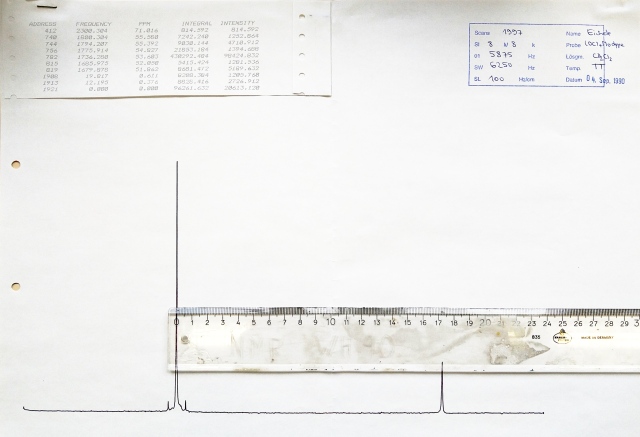
I still remember times when peak picking involved a DIN A3 paper plot and a ruler. The details of the story here reminded me of those times. On this page, I shall describe my observations that triggered this investigation and provide some background information on spectral representations.
(1) Observations with TopSpin:
A common observation is that coupling constants calculated as differences between picked
peaks usually show errors that are smaller than the digital resolution. The reason is that often
an interpolation scheme is used. Starting point is the simplest definition of a peak (additional criteria
are required to get sensible results): the two points on either side will have lower intensities
[1, p 65].
Taking the location of this highest point will result in a peak picking with an accuracy on the
order of the digital resolution. However, one could do better by taking into account the intensities
of the two neighbors: if one neighbor has a higher intensity than the other, the true peak location
should be between the highest and the second-highest intensity. And this is what TopSpin 2.1.8 does,
shown in the figure below (this is scalable vector graphics, click on the picture to get a better
representation): for the peak at 1999.97 Hz, one neighbor is almost as high as the peak point,
hence the peak position is assigned to the location almost half-way between both points.
The peak at 1995.419 has neighbors that are almost equal, therefore the peak label is almost
at the highest point.

Things get strange, however, if you look at the output of TopSpin 4.1.4 (TS 3.6.3 gives the same result)! For the first peak at 1999.971 Hz, the picked location is not between highest and second-highest, but highest and lowest intensity. Even stranger, the second peak is not close to the highest point, but again between highest and lowest intensity. The same is true for the other peaks. As a result, there are some small differences between the numbers assigned to those positions. So, TS 4.1.4 screws up and TS 2.1.8 is ok? Actually, it is not that simple, as shown in the figure below.

The above figure shows what happens if the peak picking is done in TS 2.1.8, but the result plotted with TS 4.1.4. The peak positions assigned by TS 4.1.4 are shown in pastel for comparison. Because the differences in frequencies are small, it is reassuring that the corresponding peak markers are close to each other. However, the peak positions that looked good in TS 2.1.8 look wrong now.
The consequences of the different peak picking results are illustrated by the following multiplet analysis:

The result using TS 2.1.8 is amazing. With TS 4.1.4, the differences are still smaller than the digital
resolution (see below), but the results could be better! Obviously, in order to figure out what's going on we need to start from scratch!!!
(2) Triangular Interpolation:
The easiest interpolation is a triangular interpolation using an isoscelese triangle, e.g. [3].

|
Suppose we have identified three neighboring points that define a peak: left point L, center point C, and right point R.
In an NMR spectrum, the three points are equidistant on the frequency scale, they are separated by the digital resolution D. Interpolation is achieved by constructing an isosceles triangle through L,C,R, the base of which is defined by the point of lowest intensity, in the present case R. With respect to this base, the second highest intensity is J above this base, and the highest intensity is H above this base. From this construction, the position of the true peak P can be worked out: it is f away from the second highest point (L) and higher by y than this point: f = D (1 - J/2H)
y = H (1 - J/2H) |
Let's take the peak at highest frequency from the above example to work out the peak position manually. You can download the example spectrum in case you want to check yourself:
| a H-1 NMR spectrum of 1,2-dibromopropionic acid (500.13 MHz). |
- using the spectrum cursor (in TS 4.1.4), we can identify the indices of the points L,C,R, an estimate of the frequency (very dependent on actual cursor position), and the intensity:
index frequency (cursor) frequency (calc) intensity 17972 2000.3243 2000.32430667 1.088e+06 17973 2000.0083 2000.00904245 1.154e+06 17974 1999.6942 1999.69377823 6.715e+05 - Because we want to have a close look at the interpolation, we don't want to rely on crude cursor readings. Therefore we will calculate the positions exactly using
acquisition and processing parameters:
- SW_h: 10330.578 (the spectral width in Hz)
- SI: 32768 (the number of points of the real part of the spectrum)
- SF: 500.13 MHz (the frequency of the chemical shift standard)
- OFFSET: 15.32789 ppm (the chemical shift of the first point; its frequency is
v(0) = OFFSET*SF = 7665.9376257 Hz) - HZpPT: 0.315264 (the digital resolution, HZpPT = SW_h/SI = 0.31526422119; this corresponds to D of the triangular interpolation)
- with this information, the frequency of a point of one-based index i is then given as:
v(i) = v(0) - (i-1)*D;
the resulting frequencies are collected in the column frequency (calc) in the table above - for the high-frequency peak, we can calculate the following parameters:
D = 0.315264221191
H = 482500
J = 416500
f = 0.179194223133146
y = 274250
P = 2000.14511244611
Y = 1362250
- Obviously, the peak position that we calculated, 2000.145, does not correspond to the value reported by TS 4.1.4, 1999.971. But we knew already that TS 4.1.4 has a problem, because the center point has a frequency of 2000.00 Hz and the true maximum should be to higher frequencies. But why does TS 2.1.8 also report a value below 2000 Hz? Using the spectrum cursor in TS 2.1.8, it appears that the frequencies of L,C,R are 2000.167, 1999.852, 1999.535. They appear to be shifted by about D/2 as compared to TS 4.1.4!
- Bottom line: TS 2.1.8 addresses the points incorrectly, but picks the proper maximum location
between them. Because the frequencies of the points are incorrect, the actual peak position is
incorrect also, it is roughly off by -D/2. However, the differences between peaks should be good. TS 4.1.4 addresses the points correctly, but picks the wrong
maximum location.
Workaround: a fair amount of zero filling should reduce the errors. - Intensities: Topspin also reports the intensities in the peak tables. TS 2.1.8 reports an intensity of 1088265 (that's the intensity of L), TS 4.1.4 reports 1154323 (that's the intensity of C). Our interpolation yields 1362250; a deviation between the proper intensity and the TS 2.1.8 value of 25%!!
(3) Parabolic Interpolation:
I am not going into this yet, but in principle this should be a better approximation to the top of a peak. Some information can be found in the PARSHL documentation [4].
(4) Comparison:
Here, I shall compare the performance of TopSpin to other NMR software, once I find the time to continue this story.
Literature:
- Lindon, Ferrige, Progr. NMR Spectrosc. 1980, 14, 27; doi:10.1016/0079-6565(80)80002-1
- Hoffman, Levy, Progr. NMR Spectrosc. 1991, 23, 211; doi:10.1016/0079-6565(91)80005-M
- Collier, Martin, van Antwerpen, J. Soc. Inf. Disp. 2007, 15, 391; doi:10.1889/1.2749325 (currently, and typically, Wiley is screwing up the resolution of the DOI and you are redirected to a different article, but at least it's the correct journal)
- Smith, Serra, PARSHL: An Analysis/Synthesis Program for Non-Harmonic Sounds Based on a Sinusoidal Representation 1987, https://ccrma.stanford.edu/~jos/parshl/
- Hoch, Stern, NMR Data Processing, Wiley-Liss, New York, 1996; ISBN: 978-0-471-03900-6
[ Anorg. Chemie ] | [ Go Home ] | webm@ster | last modified: 20.04.2023