[Uni Tübingen] - [Mat.-Nat. Fakultät] - [Fachbereich Chemie] - [Anorg. Chemie] - [Klaus Eichele] - [Software] - [WSolids1] - MAS

|
WSOLIDS1:
|
Description
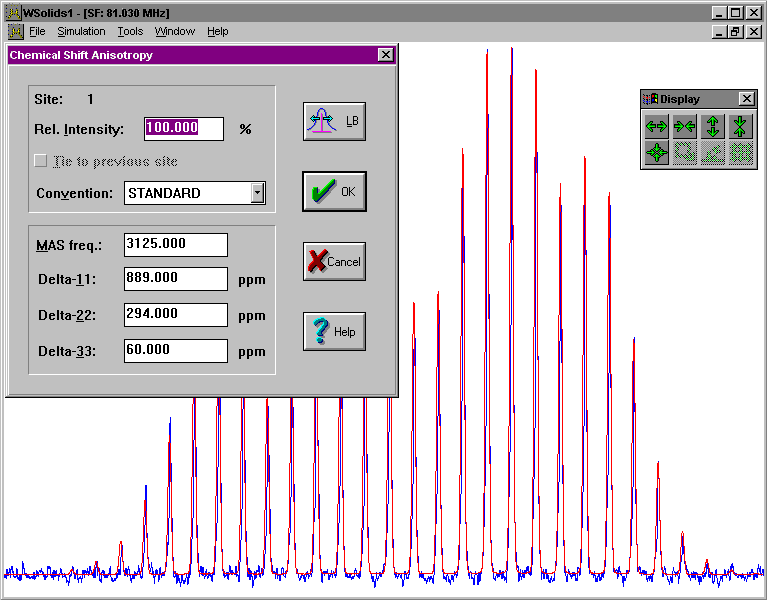
This squeezed picture shows an example for the succesful simulation of a spectrum arising from chemical shift anisotropy in a powder sample under magic-angle spinning. It is the 31P CP/MAS NMR spectrum of a phosphinidene ruthenium cluster, nido-Ru4(CO)13(μ3-PPh), and the results have been published in:
K. Eichele, R. E. Wasylishen, J. F. Corrigan, N. J. Taylor, A. J. Carty:
Phosphorus-31 Chemical Shift Tensors of Phosphinidene Ligands in Ruthenium Carbonyl Cluster Compounds: A 31P Single-Crystal and CP/MAS NMR Study.
J. Am. Chem. Soc. 1995, 117, 6961-6969.
Click on the picture to have a better look.
Background
In addition to the chemical shift anisotropy (CSA), the spectrum of a spin in a powder sample under-magic angle spinning will depend on the spinning frequency, if the spinning frequency is lower than the width of the chemical shift powder pattern. In this case, the isotropic peak (center peak) is flanked by spinning sidebands spaced at integer multiples of the spinning rate. The intensities of the spinning sidebands are intimately related to the principal components of the chemical shift tensor. For efficiency reasons, WSolids uses look-up tables of precomputed spinning sideband intensities, if the combination of span of the chemical shift tensor and spinning rate is within the range of the Herzfeld-Berger tables. Otherwise, the spinning sideband intensities are calculated in the frequency domain.
Examples
The SVG images shown below were produced using the following tools: my own SpecPlot to plot the spectra, Platon to plot the molecular structures from X-ray data, and Inkscape to compose the picture.

|
P-31 CP MAS NMR spectrum of a powder sample of nido-Ru4(CO)13(μ3-PPh): this example is the one shown in the description above. Sorry for the crowded picture, but the background contour plot shows the result of an Herzfeld-Berger analysis of the spinning sideband intensities using my program HBA. The red circle of the fit result also marks the position of the isotropic peak of the spectra. The Herzfeld-Berger parameter μ, 21.5, is outside the range of the original tables. In case you would like to reproduce the analysis using the embedded experimental spectrum: Generally, when reading a spectrum WSolids1 considers it an experimental spectrum, but when saving spectra, it will always save the calculated spectrum, if available. Therefore, to obtain the experimental spectrum one should invalidate the calculated spectrum first. The easiest way is to change under Simulation|Spectrum Default Parameters the value of SI. Now you can save the experimental spectrum in the required format. |
[ Anorg. Chemie ] | [ Go Home ] | webm@ster | last modified: 22.01.2024